Basic Campaign Statistics
Now that you have sent your first campaign, it's time to take a look at your campaign statistics. In this chapter we will look at Sent, Rate Bounces, Forwards and Views, the four most fundamental campaign statistics.
The statistics overview page
First, go to Statistics > Statistics overview.
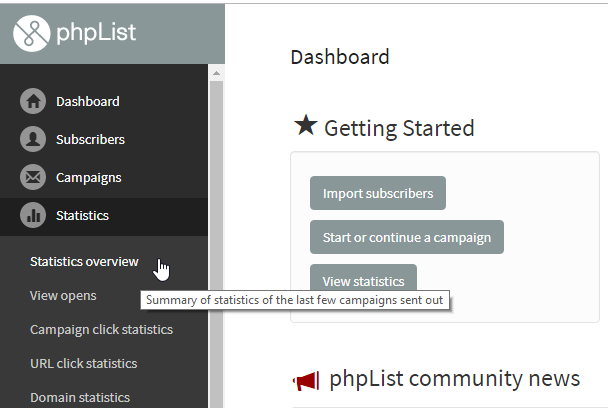
This will show you a summary of all the campaigns you sent in the past year (in this case, we have just sent one).
Sent
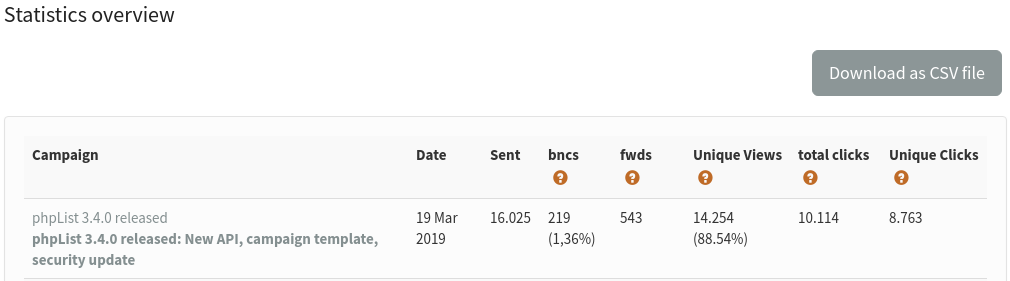
In this example, we sent our campaign to 16.025 subscribers and this is reflected in the Sent column. It is useful to see how many subscribers you have for each campaign, so you can see your list grow over the year.
Bounces
The second column BNCS shows the number of emails that "bounced." A bounced email is one that cannot reach its intended recipient. This could be caused by any number of things, for example:
- The email is incorrect, does not exist or has an error such an expired domain
- The Mailbox is full (this may be temporarily or not)
- A badly configured auto-responder (automated "I'm on Holiday till" of "I got your message and will reply soon" type mails)
The exact definition of a bounce depends on your phpList configuration, and it can take several days for a bounce to be registered on the system. An email which continues to bounce will eventually be either unconfirmed or added to a do-not-send list.
A high bounce rate may be a sign of poor list quality.
In this campaign, there were 219 bounces.
Forwards
The third column fwds show the number of people who have forwarded the mail through the phpList ForwardToFriend system. This is dealt with in Advanced Statistics.
Unique Views
This is the most exciting of your statistics, but also the most misleading.
In this case, our email was "viewed" by 14,254 of the 16,025 recipients, which gives us an open RATE of 88.54%. However, it is important to understand the limitations of this statistic, so you don't become frustrated or disillusioned by what may seem like low readership levels.
The Unique views statistic:
- Tells us how many people were recorded opening their email (and presumably read the contents)
- Tells us the minimum number of people who opened the email
- And gives us a rate that reflects the number of people opening an email compared to other emails we send.
- Does not tell us exactly how many people opened the mail, or what they did when they opened it.
Total clicks
If you have included links on your campaign, phpList can tell you how many times your subscribers have clicked on them. This number indicates the total amount of times a link has been clicked, whether it is from the same subscriber or not. Also, this is the total amount of times all your links were clicked, not each one separately. This will help you evaluate further your campaign’s performance.
Unique clicks
The “Unique clicks” value is always less than the “Total clicks” value because it represents the number of times each link on your campaign was clicked for the very first time. For example, if you have included two links on your campaign and a subscriber has clicked 3 times on each link, this will show up as “2” and not “6”.
Accuracy of email open tracking
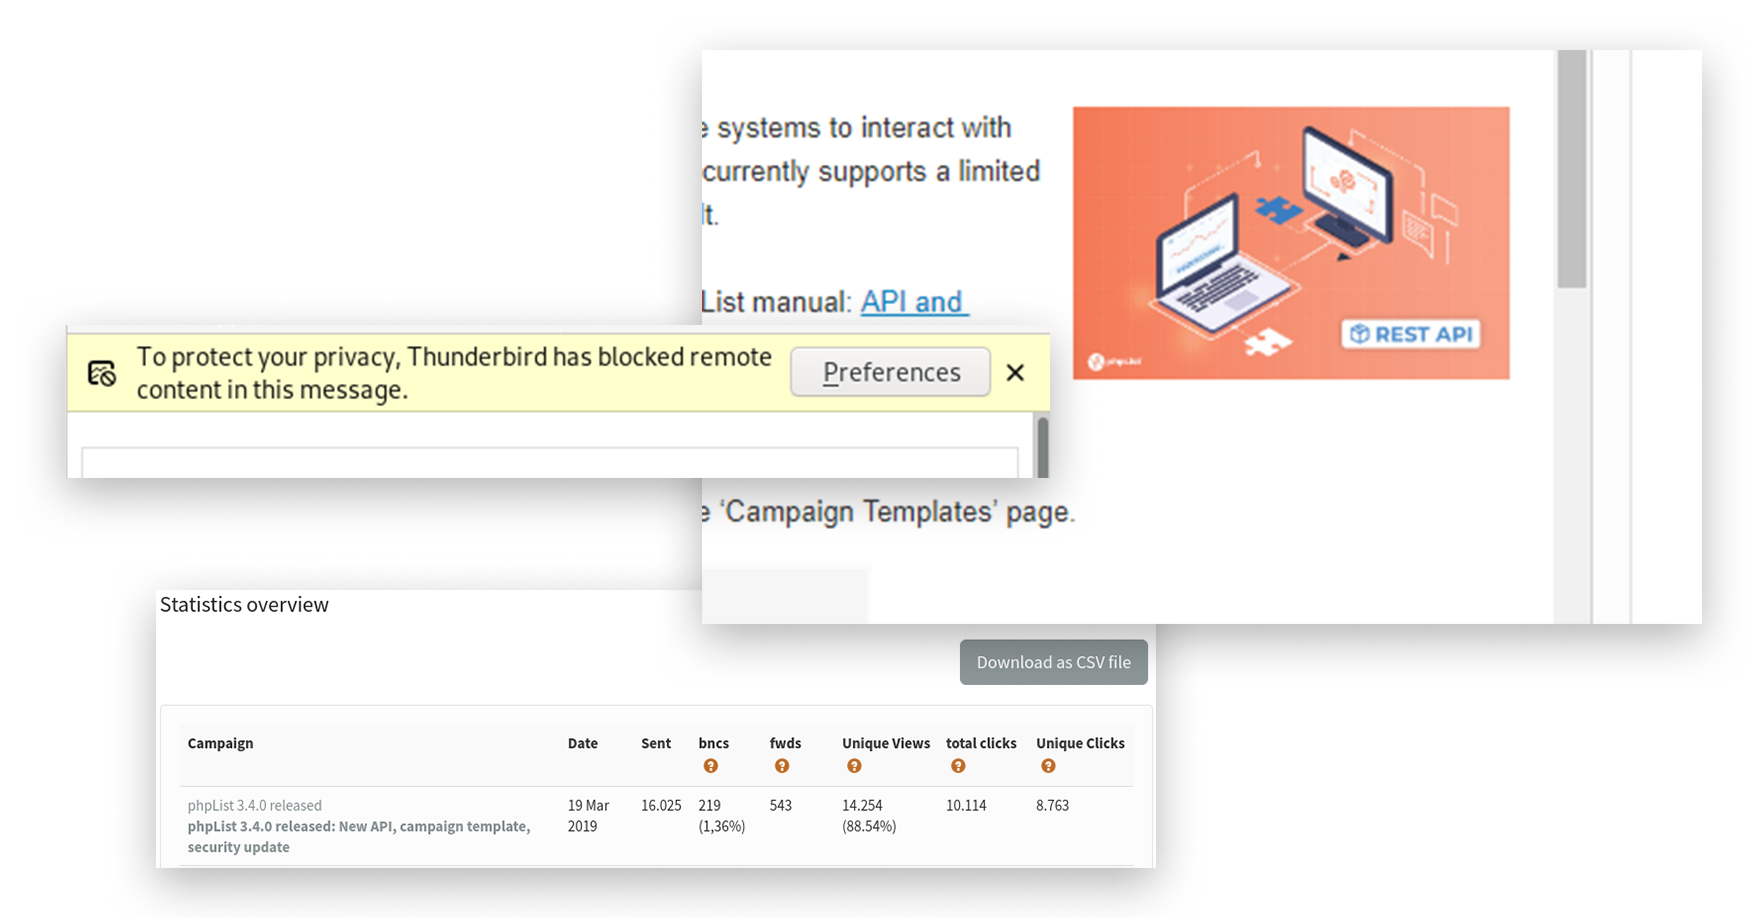
The major cause of inaccuracy when recording views is image blocking. If images/remote content are blocked by a subscriber's email software, then the action of your subscriber opening the email cannot be reported back to phpList (or to any system). Image blocking is therefore quite commonly used as a privacy feature by email and webmail clients.
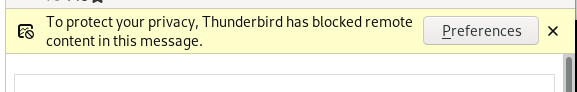
Only when your subscriber clicks, for example Show Remote Content, is the view recorded in your campaign statistics.
Still a useful statistic
This inaccuracy is the same for everyone, no matter which software they are using to send their campaign; any "open rate" averages you see discussed on-line or in books are subject to the same rules.
It is difficult to estimate how much higher your real readership is, additionally the inaccuracy rate will vary from campaign to campaign. If we bear this in mind, we can still make some comparisons, for example, "have I received more views over several campaigns" and "how do I compare to the industry average"
What's the difference?
The difference between the real open rate and the statistic may be very significant: in this case, a quick study found that only 1 in 3 of the customers who bought the cat food in the hours after the email was sent showed up in the open results, and the cat food offer was only advertised by email. In this case, the real open rate could be more like 80%.
Rate
To compare performance across several campaigns you can use the RATE statistic, which is the number of opens expressed as a percentage of the total sent. In this first campaign, we had an open rate of 25%.
Over time, as our list keeps growing, we can still compare back to see if we are keeping our subscribers interested. The rate statistic can also be used to:
- a/b test email titles and sending times
- to compare readership between lists
- and even to benchmark performance against industry averages.
Summary
This Statistics Overview page is useful for comparing and contrasting the successful campaigns. This can help you to improve your future campaigns. However, the statistics should not be taken too literally.
Feedback
You can discuss this chapter here.